
Implied Probability and Overround: The Math Every UK Bettor Should Know
 Available in US
If you take only one analytical concept away from this whole cluster of articles, make it this one. Implied probability and overround are the two numbers that determine whether any bet you’re considering is worth taking, and the vast majority of UK football punters don’t compute either of them before placing a stake. Around 290 million online bets a month flow through UK operators on real-world events. A meaningful fraction of those go on at prices that the punter has never converted to implied probability and never compared to their own probability estimate. That’s not betting — that’s gambling with extra steps.
What I want to do here is walk through the math from the ground up. Nothing exotic, nothing requiring a spreadsheet. Just the arithmetic that every serious bettor learns within their first month and the casual bettor never quite gets around to.
From Decimal Odds to Implied Probability
Decimal odds are the easier format for this math. Implied probability is just one divided by the decimal odds. A price of 2.00 implies fifty percent (1 / 2.00 = 0.50). A price of 3.50 implies 28.57 percent (1 / 3.50 = 0.286). A price of 1.50 implies 66.67 percent (1 / 1.50 = 0.667).

That conversion is the entry point to everything. Without it, you’re staring at numbers like “Manchester City 1.40, Brentford 7.50, Draw 4.50” without any meaningful sense of what those prices are telling you. With it, you can immediately translate the line into “Manchester City 71.4 percent, Brentford 13.3 percent, Draw 22.2 percent” — and now you can ask whether you actually agree.
The agreement question is where betting starts. If your reading of the fixture is that Manchester City should win sixty-five percent of the time, you don’t bet them at 1.40 — that price implies 71.4 percent, which is above your own estimate, so the bet is negative expected value. If your reading is that Brentford should win 18 percent of the time, you bet them at 7.50 — that price implies 13.3 percent, which is below your estimate, so the bet is positive expected value.
This is the entire analytical framework. Convert the price, compare to your own estimate, bet when the price’s implied probability is below your own estimate. Pass when it isn’t. Everything else is window dressing.
What Overround Is and Why It Exists
If you add up the implied probabilities of all the outcomes on a market — home, draw, away on a football 1X2, or favourite-versus-underdog on a tennis match — you’ll find the total exceeds 100 percent. On the Manchester City example above, the three implied probabilities (71.4 + 13.3 + 22.2) sum to 106.9 percent. That extra 6.9 percent is the overround.
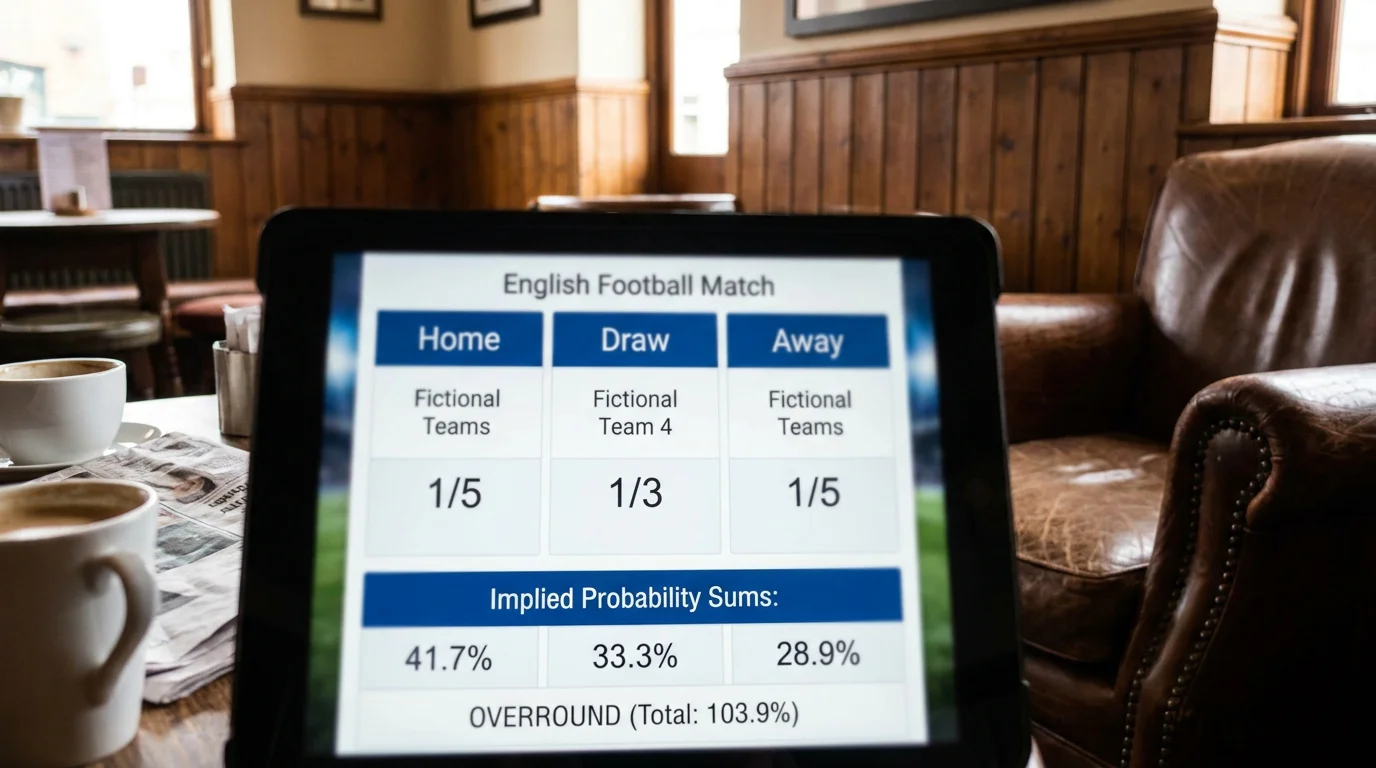
Overround is the bookmaker’s margin. It’s the amount by which the prices are tilted in the bookmaker’s favour relative to the underlying true probability distribution. On a fair-priced market, the implied probabilities would sum to exactly 100 percent and the bookmaker would expect to break even over time. On a real market with overround, the bookmaker expects to win on average regardless of which outcome lands.
Premier League 1X2 markets typically have overrounds between five and eight percent. Asian handicap markets have overrounds of two to three percent (which is why they’re sharper). Outright markets on long-running competitions like the FA Cup have overrounds of twenty percent or more (which is why outright betting is so hard to win at).
Knowing the overround on a market doesn’t tell you which outcome to bet, but it tells you how much you have to beat the market by before you’re breaking even. On a six-percent overround 1X2 market, your own probability estimates need to be more than six percent better than the market’s implied probabilities — averaged across the three outcomes — before you have positive expected value. That’s a high bar, and it’s why finding genuine edge in football betting is hard.
Fair Prices Versus Quoted Prices
The “fair price” of an outcome is the price you’d be quoted on a zero-margin market. Calculating it requires removing the overround proportionally from each leg of the quoted price.

Take the Manchester City example. The quoted prices imply 106.9 percent across the three outcomes. The fair implied probabilities are each outcome’s quoted implied probability divided by 1.069. So Manchester City’s fair probability is 71.4 / 1.069 = 66.8 percent. The fair decimal price is 1 divided by 0.668 = 1.50. The quoted price (1.40) is shorter than the fair price (1.50), which means the bookmaker is taking margin on this leg.
You can do the same calculation for each outcome. Brentford’s fair price is 8.04 (quoted 7.50). The draw’s fair price is 4.82 (quoted 4.50). All three legs have been shortened from fair by the bookmaker’s margin, distributed roughly proportionally across the three outcomes.
Calculating fair prices is the most useful single math exercise you can do before betting. It gives you a clean reference point — what would the market look like with no margin? — against which you can assess whether your own estimates are far enough off the market to justify a position.
The exercise also reveals which operator is more competitive on a specific fixture. Two operators with different overrounds on the same match are pricing slightly differently, and the one with the lower overround is offering the punter the better deal. Comparing fair prices across operators is one of the cleanest ways to identify which book to use for a specific bet.
How Margin Compounds on Multiples
The compounding of margin across multiple legs is where casual bettors lose money most consistently, and it’s the math that makes accumulators structurally bad bets without specific edge.
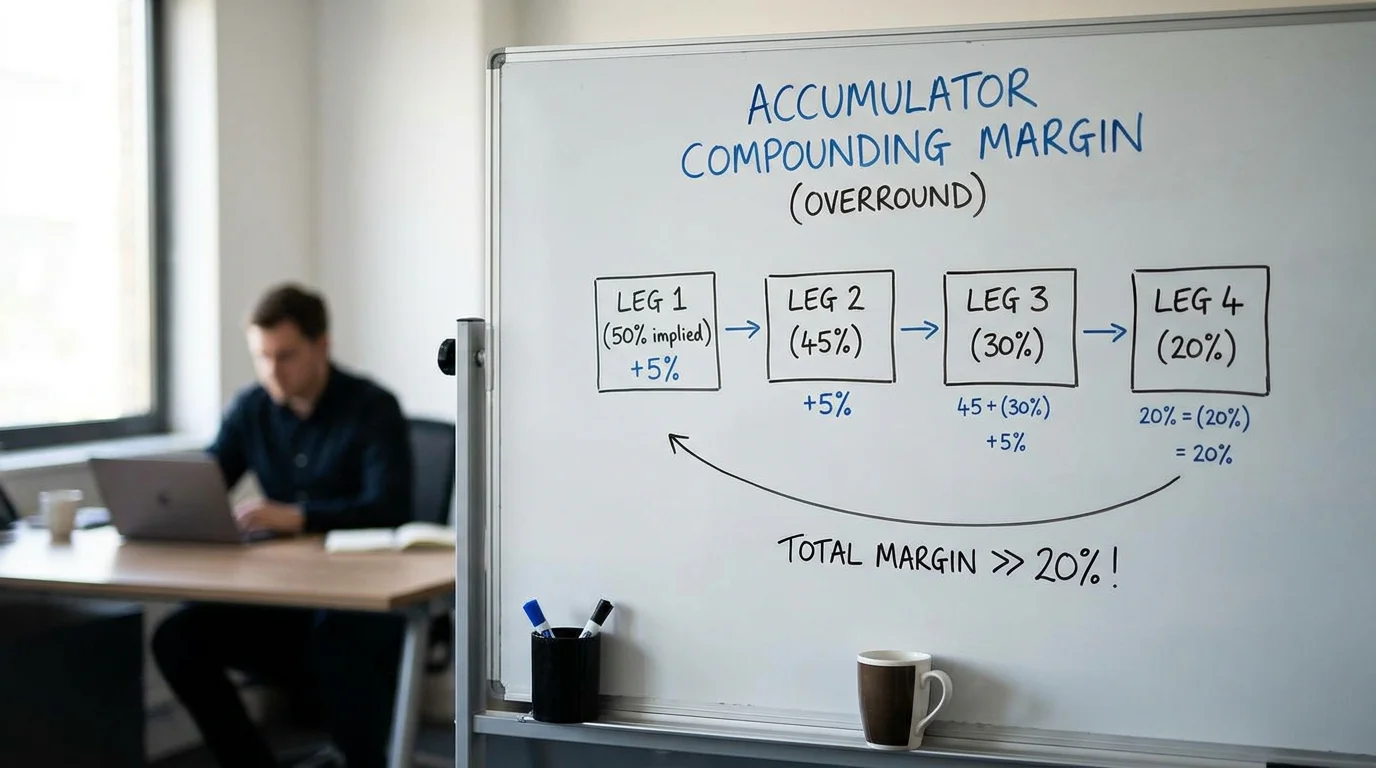
Each leg of an accumulator carries the bookmaker’s margin. On a six-percent overround per leg, the bookmaker is paying out roughly ninety-four percent of fair value per leg. Two legs combined pay out 0.94 × 0.94 = 88.4 percent of fair. Five legs combined: 0.94⁵ = 73.4 percent. Eight legs: 0.94⁸ = 61.0 percent.
That’s an enormous tax on every multiple-leg ticket. To overcome it with your selections, your own probability estimates need to be wildly better than the market’s implied probabilities on every single leg — and the compounding errors in your own analysis tend to grow with leg count rather than shrink.
The implication for serious betting is that multiples should be used sparingly, only on legs where you have strong individual reads, and the implied-probability-versus-fair-price math should be done on each leg before stacking them together. A four-fold of fair-but-marginally-positive-value singles is a positive-expectation bet. A four-fold of marginally-negative-value singles is a wealth-destroying bet, and the difference between the two often isn’t obvious from the quoted prices alone.
Using the Math to Find Value
The practical workflow that translates this math into actual bets looks like this. Before placing any bet, convert the quoted price to implied probability. Estimate your own probability for the outcome based on whatever analytical method you trust. Compare the two numbers. If your estimate exceeds the implied probability by more than the overround percentage of the market, the bet has positive expected value. If not, pass.

The mechanical version of this discipline is to maintain a betting log that records, for every bet placed, your own probability estimate alongside the implied probability of the price taken. Over time, the log tells you two important things. First, whether your own estimates are actually accurate (compare estimated probabilities to actual outcome rates across hundreds of bets). Second, whether your selection process is finding genuine value (compare realised yield to predicted yield given your probability estimates).
Almost everyone discovers their probability estimates are noisier than they thought. That’s not failure — that’s information. Adjusting your edge expectation downward to match what your log shows is the path to long-term profitable betting. Refusing to adjust, and continuing to bet on imagined edges that the log doesn’t validate, is the path to long-term losses.
The other thing the log tells you is which market types you’re actually good at. Most bettors find they’re better at some markets than others — totals over match-result, individual props over goalscorer, lower-tier over top-flight. Following the data toward the markets where your own estimates are most accurate is how you maximise the edge that genuinely exists.
For the related question of how the practitioners with the biggest analytical advantages — the academic researchers building xG-based prediction models — translate this math into actual betting strategies, see the analysis in the piece on player props on the Premier League.
