
Correct Score Betting: The Highest-Margin Market in Football
 Available in US
Correct score is the market casual punters love and serious bettors mostly avoid. The headline prices look generous — back a 2-1 home win at 8.50, back a 3-2 at 16.00 — but the underlying margin built into the correct score grid is the widest you’ll find on any standard football market. The UK remote football betting GGY of £1.3 billion in the year to March 2025 includes meaningful turnover on correct score precisely because the prices look attractive to people who don’t compute the implied probabilities. Andreas Krannich at Sportradar has emphasised the importance of data-driven vigilance across the betting market — and the correct-score market is a place where vigilance pays better than enthusiasm.
That said, the correct score market isn’t entirely off-limits. The pricing is loose enough on specific outcomes that careful bettors can occasionally find value. The art is in identifying which scorelines are mispriced and avoiding the rest of the grid entirely.
How Correct Score Pricing Works
The correct score market lists individual scorelines from 0-0 up through typically 4-4 or 5-5, plus an “any other home win” and “any other away win” outcome to absorb high-scoring games beyond the listed range. Each specific scoreline carries its own price, with the most-likely scorelines (1-0, 1-1, 2-1, 0-0) carrying the shortest prices and the high-scoring outliers carrying the longest.
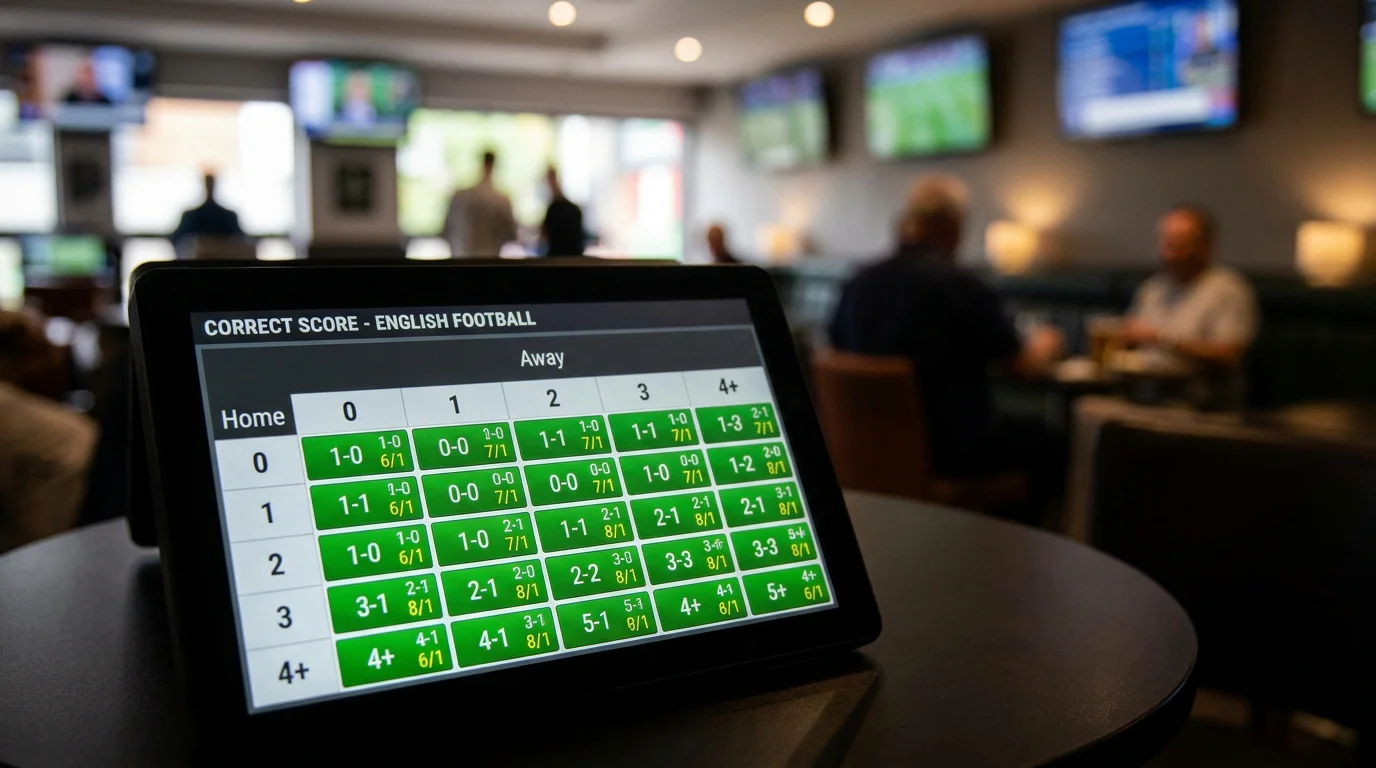
The pricing model behind correct score combines the expected goal totals for both teams (derived from xG and historical data) into a joint scoring distribution using a Poisson or related probability framework. Each specific scoreline gets a probability assigned, and the bookmaker’s price reflects that probability plus margin.
The margin is distributed unequally across the grid. The most-likely scorelines (the ones most casual punters bet on) carry tighter margins. The longshot scorelines (the 4-0, 5-1, 6-0 type prices) carry much wider margins. The wider margins on the longshots compensate for the operator’s risk on the rare-but-large outcomes that occasionally land.
The overall overround on a correct score grid is typically twenty to thirty percent — well above the five to seven percent on 1X2 markets and the ten to fifteen on HT/FT. That structural margin is the reason most correct-score betting loses money over time, even when the individual selections seem reasonable.
The Common Scorelines and Their Pricing
The four most common Premier League scorelines across recent seasons — 1-1, 1-0, 2-1, 0-0 — together account for roughly forty-five percent of all EPL match outcomes. The pricing reflects this. 1-1 is typically priced around 5.50 to 7.50, 1-0 around 7.00 to 9.50, 0-0 around 8.00 to 11.00, and 2-1 around 8.50 to 12.00.
The implied probabilities at these prices are around fifteen percent for 1-1, twelve percent for 1-0, ten percent for 0-0, and nine percent for 2-1. Cumulatively, those four scorelines have an implied probability of around forty-six percent — close to the actual historical rate.
The pricing on these common scorelines is the sharpest part of the correct-score grid because the bookmaker has the most data on them and the operator’s pricing model is most precise. Finding value on 1-1 or 1-0 specifically is hard, because the market has incorporated most of the available information.
The interesting question is whether your read on the specific fixture skews the probability distribution away from the market’s default. A high-scoring expected match has a higher 2-1 and 2-2 probability and a lower 1-0 and 0-0 probability than the market’s default. If your read is that a particular match’s expected goal count is well above average, the 2-1 and 2-2 prices have more value than the 1-0 and 0-0 prices. If your read is the opposite, the inverse applies.
Defensive Fixture Specifics
The cleanest correct score betting opportunities I find each season are on fixtures expected to be heavily defensive — relegation six-pointers, tight Championship matches, low-tempo fixtures between two passive defenders. The market’s default pricing on 0-0 and 1-0 outcomes on these fixtures is often conservative, leaving room for value bets on the low-scoring outcomes.
A relegation six-pointer between two defensively-organised mid-table sides might have a 0-0 priced at 9.00, when the underlying probability is closer to fifteen percent. That’s a meaningful edge, available repeatedly across a season on the right fixtures.
The opposite case — high-scoring expected fixtures — is harder to find value on. The market is sharper on the over-2.5 and over-3.5 totals markets, and the correct-score equivalent (3-2, 3-1, 4-1, etc.) tends to be priced reasonably accurately. The exception is the 2-2 scoreline, which is often slightly under-priced because casual punters tend to back specific winners rather than draws even when the underlying probability of a high-scoring draw is high.
The other defensive-fixture edge is on the 1-0 scoreline specifically. The 1-0 outcome happens roughly twelve percent of the time in EPL matches but the pricing often implies a slightly lower probability than that. Backing 1-0 on home favourites known for grinding out single-goal wins is a persistent small edge.
Combining Correct Score with Anytime Scorer
The “correct score and goalscorer” combination market — where you predict both the exact scoreline and one player to score — extends correct-score pricing into a more specific prediction with correspondingly longer prices. A 2-1 home win with Player X to score might be priced at 25.00 or longer.

The underlying math compounds two probabilities. If 2-1 has a probability of nine percent and Player X scoring has a probability of forty percent on the same fixture, the joint probability is roughly 0.09 × 0.4 = 3.6 percent. The fair price would be around 28. If the market is offering 25, the bet is slightly negative value before margin.
The complication is that the two events aren’t independent. If Player X scores, it’s more likely the match ends in a result that involves their team winning rather than losing or drawing. The joint probability is therefore higher than the simple multiplication suggests. The operator’s pricing engine handles this with a correlation adjustment, but the adjustment is often imperfect and the pricing on these combined markets sometimes leaves room for value.
The combinations where the value is most likely to appear are favourite-side striker paired with the most-likely scorelines for that favourite. A 2-0 home win with the home side’s primary striker scoring is structurally underpriced relative to the simple multiplication because the correlation between “favourite scores by two” and “favourite’s striker scores” is very high.
Why Most Correct Score Bets Lose Money
The honest summary of correct score betting is that the structural margin is so wide that finding consistent value requires a level of analytical work that most punters don’t put in. The casual approach — looking at the price and deciding whether the scoreline “feels right” — is almost guaranteed to produce long-term losses because the underlying probability you’re betting against is the bookmaker’s well-calibrated joint scoring distribution.
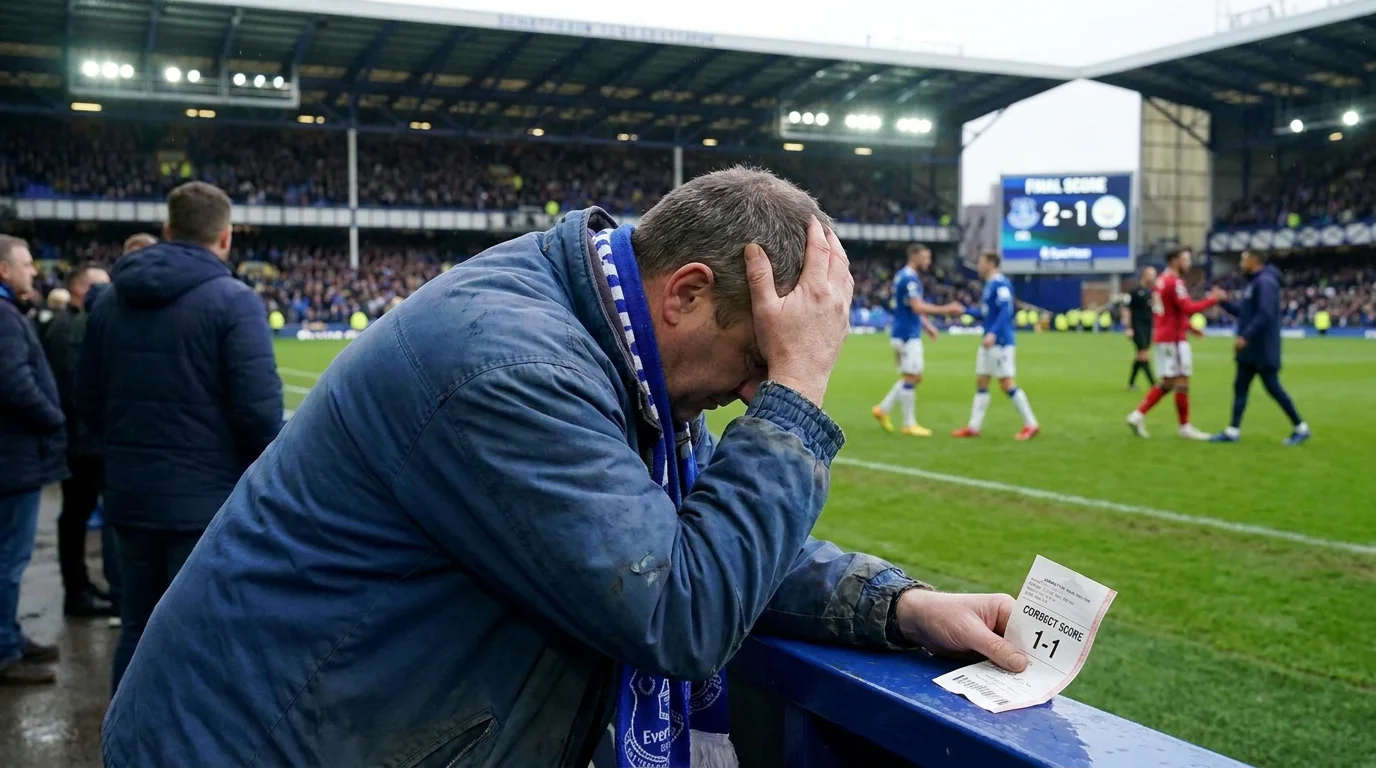
The analytical approach — computing your own scoring distribution for the fixture, comparing it leg by leg against the bookmaker’s grid, and identifying the specific scorelines where your probability exceeds the implied — produces edges but requires meaningful work per fixture.
The compromise approach that I actually use most of the time is to skip the correct-score market entirely and use my goal-totals and BTTS analysis to bet on the related but cleaner markets. Most of the analytical work that goes into pricing a specific scoreline is equally applicable to the over/under 2.5 and BTTS markets, where the margins are tighter and the implementation is simpler.
The exception is when I have a specific contextual read that points to a specific scoreline — a defensive coach playing for a 1-0 grind, a counter-attacking side likely to win 2-1 from a single moment of brilliance, a tight derby fixture likely to end 1-1 because both sides will manage their nerves. In those specific situations, the correct-score market lets you express the precise read with the price advantage the market’s structure allows.
For the related question of how high-stakes fixtures — derbies, rivalries, must-win matches — produce their own specific pricing patterns across all markets, see the piece on derby fixtures betting.
