
Half-Time/Full-Time Betting: Reading Match-State Probabilities
 Available in US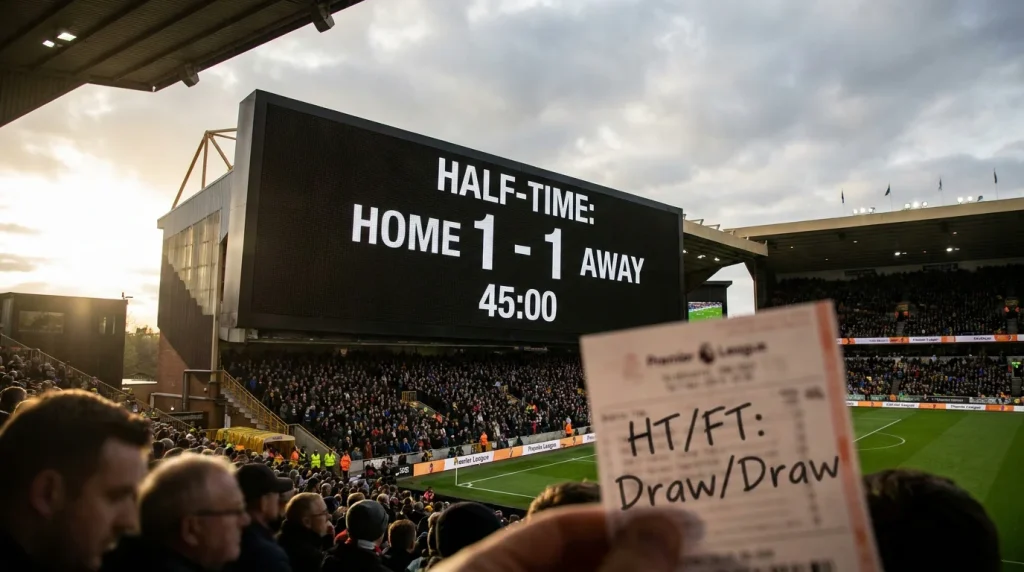
The half-time/full-time double-result market — abbreviated HT/FT — is one of those football markets that rewards careful thinking and punishes pattern-matching. The market asks two questions in one bet: who’s leading at half-time, and who wins at the end. Nine possible combinations (home/draw/away at HT crossed with home/draw/away at FT), nine prices, and a structure that’s hard to read at a glance. Around £1.3 billion in UK football GGY in the year to March 2025 includes a small but consistent share on these double-result markets, and the prices on them are looser than the headline 1X2 markets because the volume is lower.
I’ll work through the structure systematically and then get into where the actual edges live. The market is dense enough that going step by step matters more than usual.
How Nine Outcomes Are Priced
The HT/FT market has nine possible outcomes. Home leads at HT and wins at FT (HH). Home leads at HT, draws at FT (HD). Home leads at HT, loses at FT (HA). Draw at HT, home wins (DH). Draw at HT, draws (DD). Draw at HT, away wins (DA). Away leads at HT, home wins (AH). Away leads at HT, draws (AD). Away leads at HT, wins (AA).
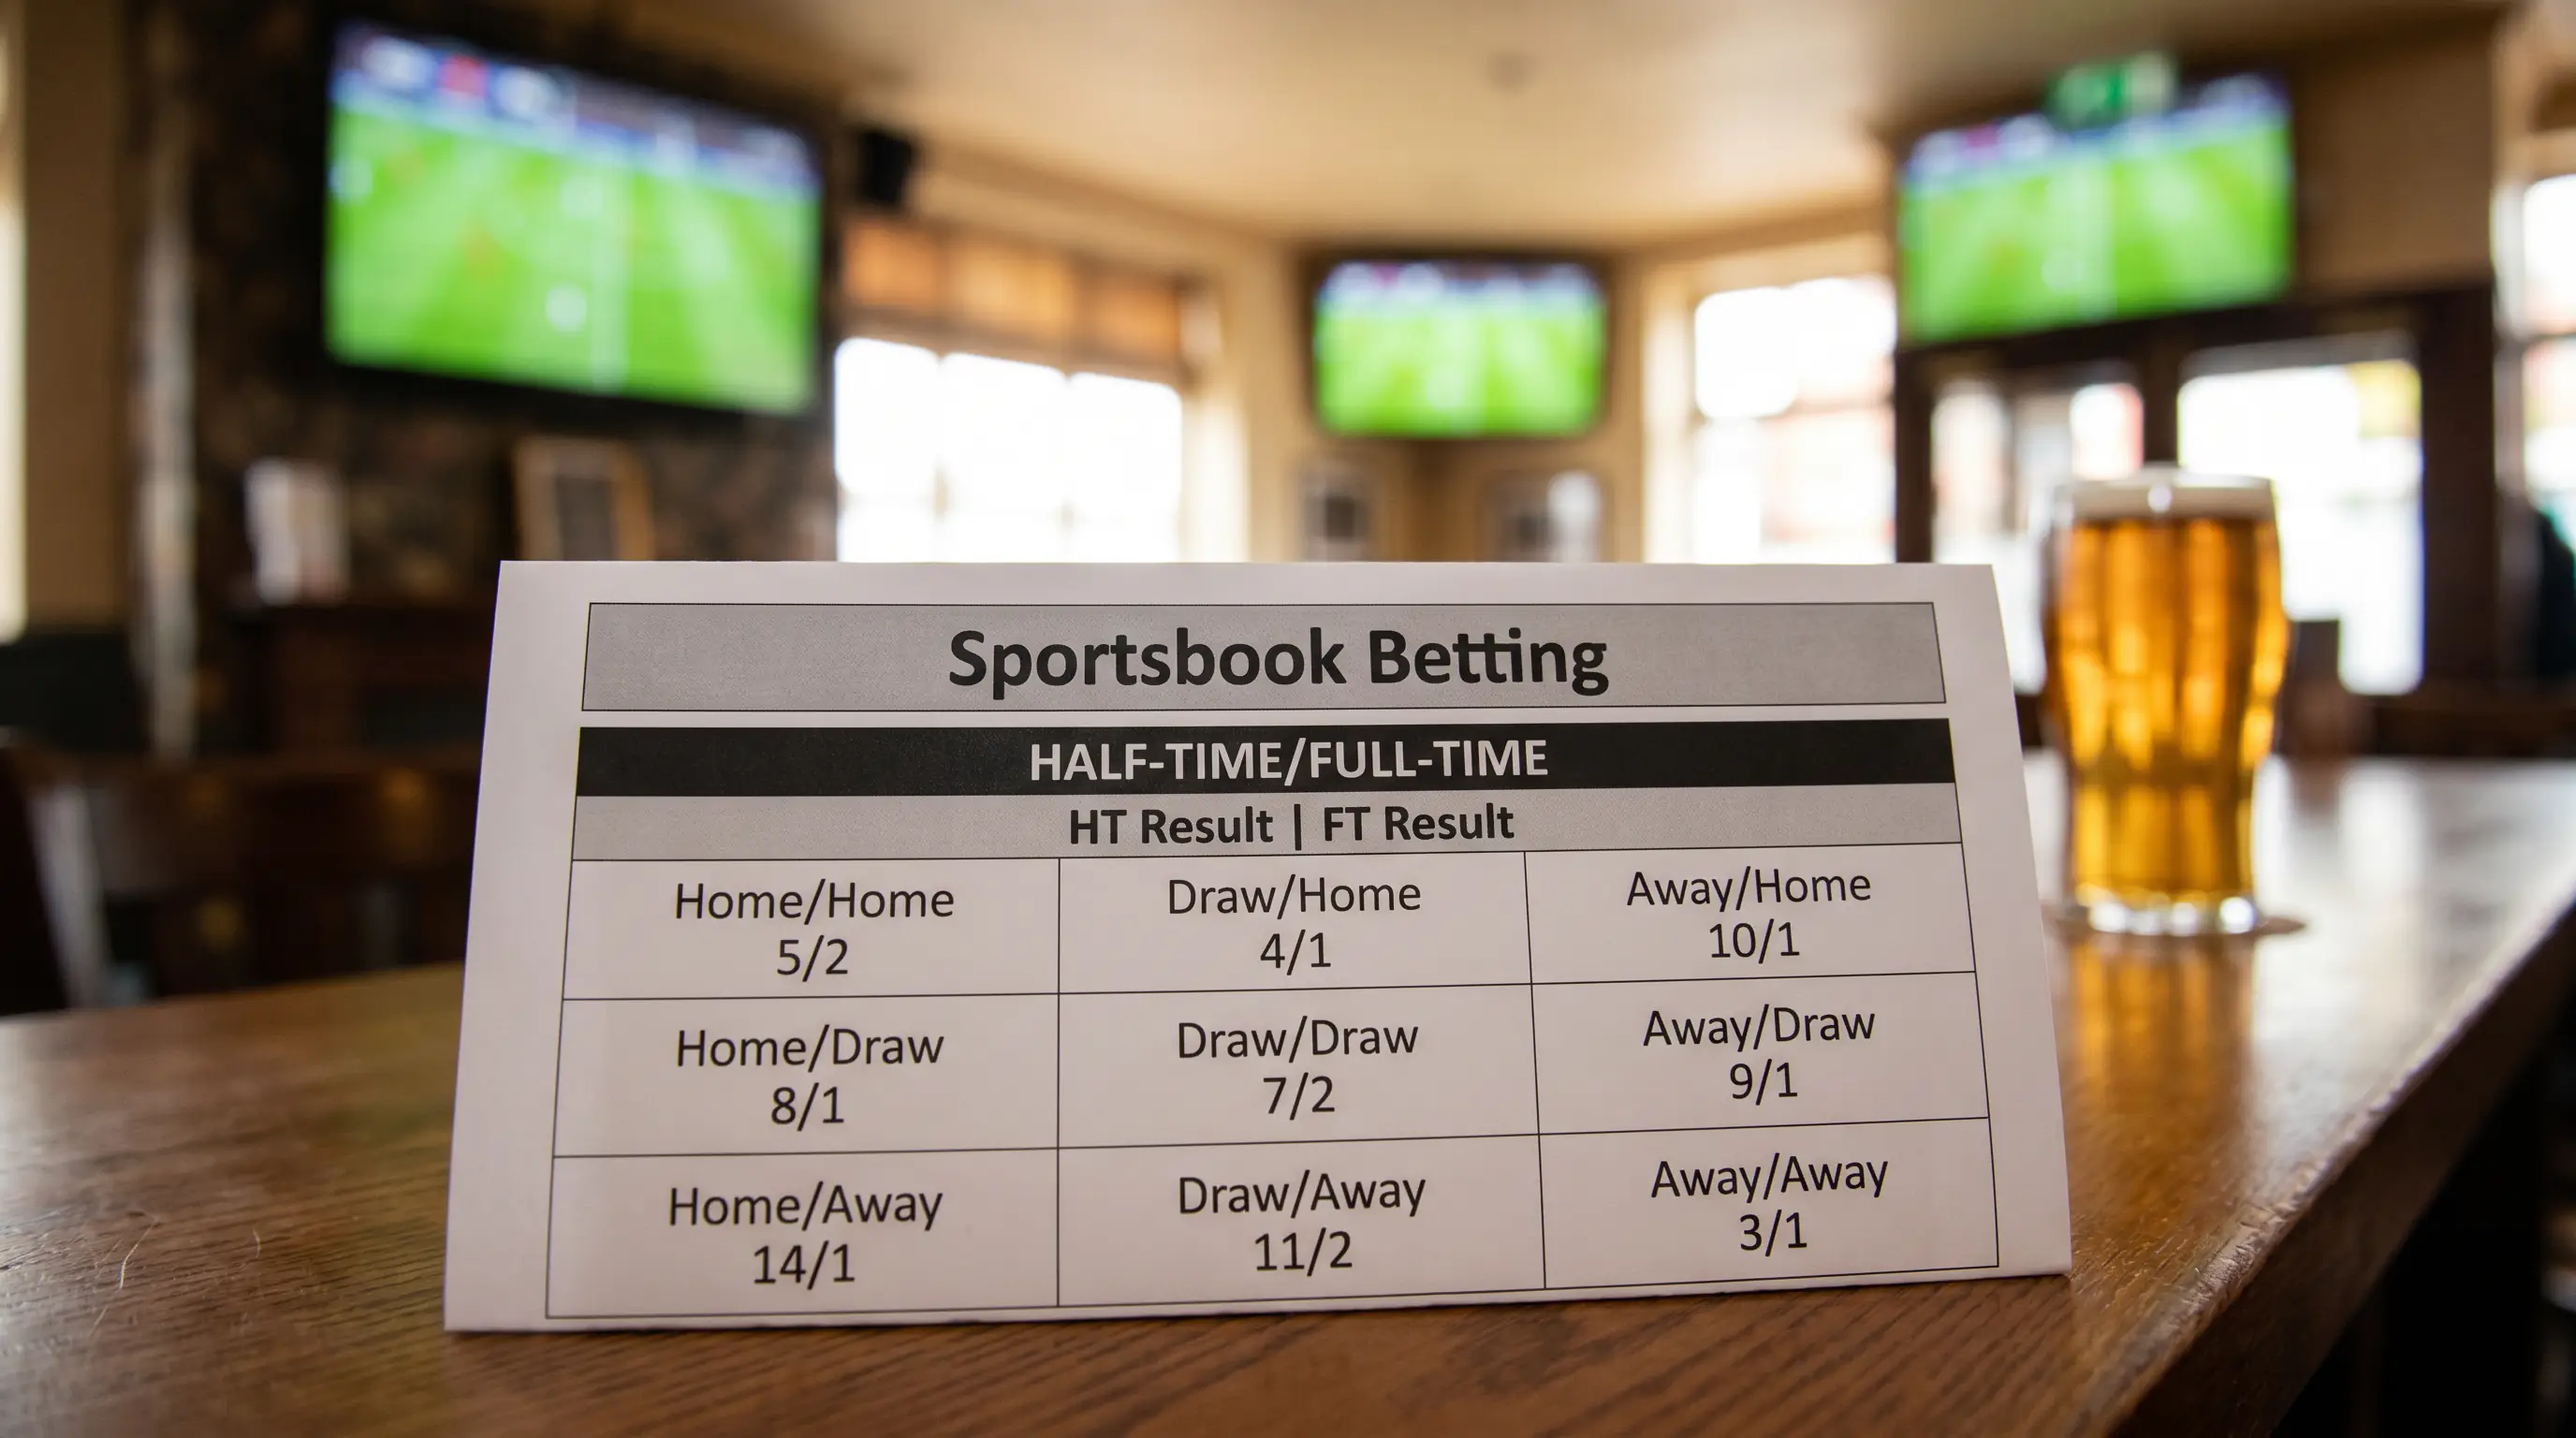
The most common outcomes are HH and AA — when one team takes the lead by half-time, they usually keep it. The next most common is DD (drawn at both stages) and the various single-stage outcomes (DH, DA, HD, AD). The rarest outcomes are HA and AH — comebacks where the half-time leader ends up losing.
The pricing reflects these underlying probabilities, but with margin distributed across all nine outcomes. The HH and AA prices are short because the underlying probabilities are highest. The HA and AH prices are very long (typically 25.00 or longer in even fixtures) because the probabilities are lowest. DD typically prices around 5.00 to 7.00 depending on how draw-heavy the fixture’s underlying expectation is.
The total overround on a HT/FT market is typically much wider than on the standard 1X2 market — often ten to fifteen percent compared to five to seven percent on 1X2. That higher margin makes finding genuine value harder, but the lower trading volume also means the pricing inefficiencies are larger when they exist.
HH and AA as the Default Outcomes
The HH and AA outcomes — the favoured side leading at half-time and winning — collectively account for the modal outcome in heavily-favoured fixtures. In matches with strong favourites, the probability of HH being correct can exceed forty percent. The market typically prices HH around 2.50 to 3.50 in these fixtures.
The strategic question is whether the HH price represents value relative to backing the same favourite on the standard 1X2 market. The HH outcome requires the favourite to be ahead at half-time, which is a more restrictive condition than simply winning at full-time. Some favourites are slow starters and win matches 1-0 with goals after the seventieth minute; others race into early leads. The HH bet is more valuable on the latter and less valuable on the former.
The fastest-starting EPL sides — typically the top-pressing teams who score frequently in the opening half-hour — are HH candidates almost every match they’re favoured. Their match data shows a high proportion of first-half goals, and the HH market doesn’t always fully price this tendency. Backing HH at 2.80 when the underlying probability is closer to forty percent represents real value.
The opposite case — favourites who systematically score after halftime and rarely lead at the break — are the candidates for the DH outcome (drawn at HT, home wins at FT). DH is typically priced longer than HH (often 4.50 to 6.50) and the underlying probability for slow-starting favourites can be substantial. The bet is harder to identify because it requires understanding which favourites are slow-starters specifically, but the price premium relative to HH compensates for the analytical work.
The DD Bet on Tight Fixtures
The DD outcome — drawn at both half-time and full-time — is the market’s pricing of the “tight match where neither side breaks through” scenario. The price typically sits around 5.00 to 7.00 on evenly-matched EPL fixtures, with shorter prices on fixtures expected to be tightest.
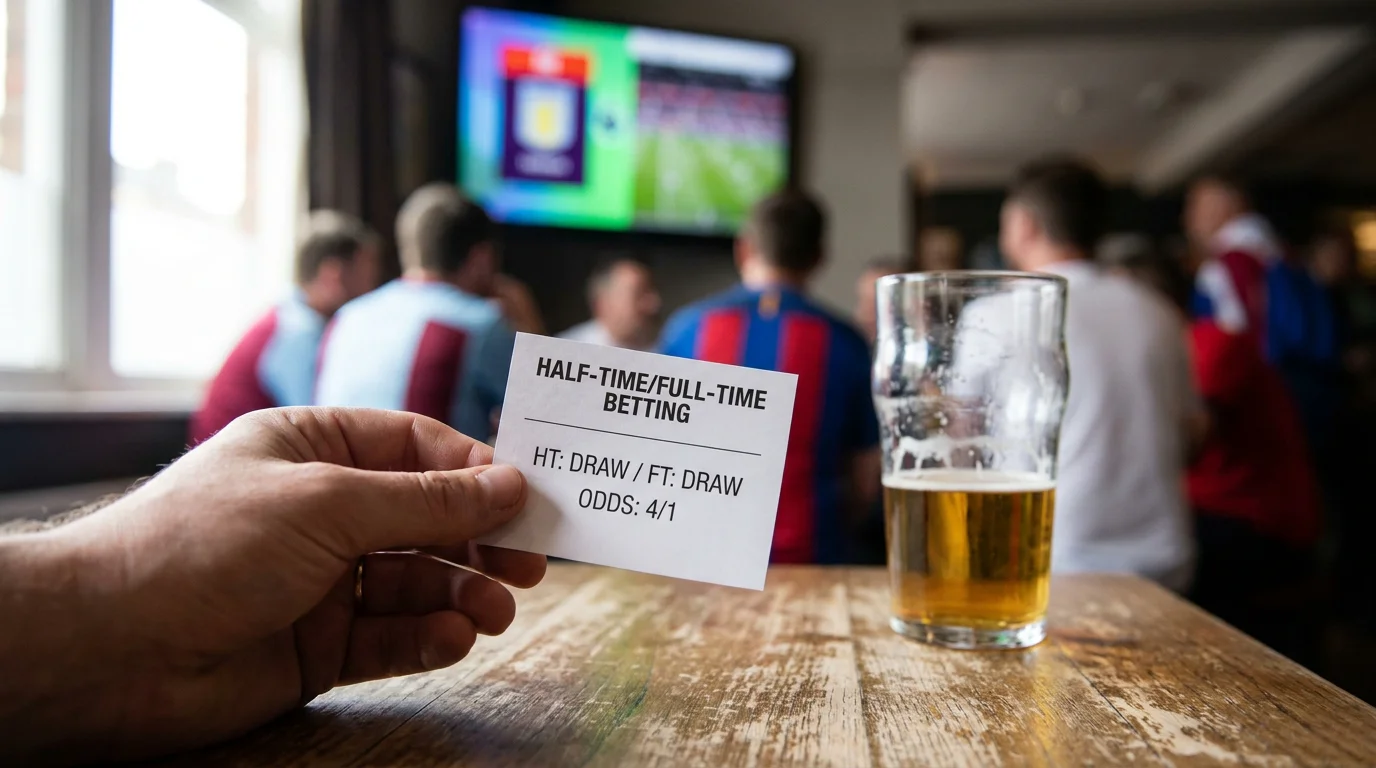
The DD bet is most valuable on fixtures between two defensively-organised sides where both teams’ attacking output is limited and neither has a clear advantage. Six-pointer relegation battles, mid-table fixtures between two similarly-pressed sides, and late-season dead-rubber matches between teams with nothing to play for all produce DD outcomes at rates above the typical pricing.
The bet is less valuable on fixtures where one side is favoured and the underlying probability of a draw is lower. The market may still price DD at 5.50 even on a fixture where the actual draw probability is twenty percent or less, which means the DD price is fair-or-worse value despite looking attractive on the surface.
The cleanest DD opportunity I find each season is in late-November-to-January Championship fixtures between mid-table sides on poor pitches. The combination of mid-table caution, winter pitch conditions, and short daylight hours (early evening kickoffs in poor conditions) produces a structural rate of low-scoring tight matches that the DD pricing doesn’t always fully capture.
The Comeback Markets at Long Prices
The HA and AH outcomes — the half-time leader losing — are the longest prices on the HT/FT market. Typical pricing is 25.00 to 40.00 depending on the fixture. The underlying probability is genuinely low (typically three to seven percent depending on the fixture’s expected variance), but it’s not zero, and the price compensation is often genuinely generous.

The bet to look for is heavy underdogs at long underdog prices who are facing favourites with specific tactical vulnerabilities. A favourite that races to a 1-0 lead but plays a fragile possession-style game can be vulnerable to a counter-attacking opponent finding two late goals. The HA bet (home leads at HT, away wins) on this fixture can be value at 30.00 when the underlying probability is closer to four or five percent.
The systematic problem with comeback markets is variance. A 30.00 price needs to win one time in thirty (3.33 percent) to break even. If your read on the true probability is five percent, you have edge, but the variance to realise that edge across enough bets is enormous. A hundred HA bets at typical 30.00 prices would settle as approximately five wins and ninety-five losses on average — and any individual run could easily produce zero wins or eight wins through pure variance.
The right way to engage with these markets is small stakes, careful selection, and accepting that the realised yield will be noisy. The mathematical edge exists but it shows up over very large samples, not over a single season of careful betting.
The Implied Probability Math on HT/FT
The most useful analytical exercise on HT/FT markets is converting all nine prices to implied probabilities and checking how they sum. The total should be at or above 100 percent, with the excess being the bookmaker’s overround. The distribution of probability across the nine outcomes tells you what the bookmaker thinks the match’s overall scoring and result distribution looks like.

If the HH and AA probabilities sum to fifty percent and the DD probability sits at fifteen percent, the bookmaker is pricing a fixture where one side is expected to take an early lead and hold it. If the HH and AA sum is closer to thirty percent and the DD is at twenty-five percent, the bookmaker is pricing a tight fixture where neither side dominates.
The mathematical advantage of this exercise is that it lets you compare the HT/FT pricing against the standard 1X2 pricing and the totals pricing. If the implied probabilities on the three markets aren’t internally consistent — say, the HT/FT is pricing a tight low-scoring match but the totals market is pricing a high-scoring match — one of the two is wrong, and the inconsistency creates an arbitrage opportunity in favour of the more-correctly-priced market.
The exercise also reveals where the HT/FT overround is being loaded. The HH and AA outcomes typically carry tighter margins (closer to fair value) because they’re the most-bet outcomes. The DH, AD, HD, DA outcomes typically carry wider margins. The HA and AH carry the widest margins of all. If you’re going to bet at the HT/FT market, the cleaner-priced outcomes are the better value targets.
For the related question of how the alternative correct-score market — which prices specific scoreline outcomes rather than result patterns — fits into the same analytical framework, see the piece on correct score betting strategy.
