
EFL Championship Betting Expert: Inside the World's Richest Second Tier
 Available in US
I tell new bettors the same thing every August: if you can only afford to follow one English league closely, make it the Championship, not the Premier League. The reasoning is uncomfortable for tradition’s sake but mathematically obvious. The top flight is the most efficiently priced football market in the world. The Championship is a 24-club, 552-match grind played in front of cameras that algorithmic traders barely watch, and where serious money was poured into the home dressing rooms by owners chasing a financial outcome worth more than most company acquisitions.
That second-tier reality became impossible to ignore in 2025/26. The Championship season closed with 1,438 goals across 552 matches — a record 2.61 per game — and crowned Coventry City as champions in front of an aggregate audience of 12.7 million the season prior, the second-best attended league in Europe. Those numbers describe a competition that looks like a Premier League shadow on the surface but trades like a different sport entirely beneath it. Below I will walk through how I read it.
Why the Championship Is Genuinely Unique
The first time I sat down to model the Championship the same way I model the Premier League, the output was nonsense. The variance was too high, the underlying numbers swung too quickly, and the assumptions I had been making about squad quality and tactical consistency simply did not hold. The second tier is its own ecosystem, and the financial backdrop is the reason.
Championship club revenue in 2023/24 reached £958 million, up 28% year-on-year. Matchday income hit a record £210 million. Those are not numbers you would expect from a “second division” in any other major European league — they sit closer to a mid-tier top-flight competition in scale. The European football market as a whole reached €38 billion the same year, with the “big five” leagues collectively crossing €20 billion for the first time, and the Championship’s growth is occurring inside that broader expansion rather than against it.

The on-pitch consequence of that financial scale is roster volatility. A club promoted from League One arrives in the Championship in August with a squad that, by January, may have been substantially rebuilt twice. Owners willing to inject equity, parachute payments cushioning recently-relegated sides and the prospect of promotion windfall combine to make team identity an unstable concept across a single season. That instability is the analytical problem you have to solve before you can find edge.
The second structural quirk worth understanding is fixture density. A typical Championship club plays 46 league matches plus the FA Cup and the EFL Cup, often resulting in nine or ten fixtures inside November alone. That schedule is brutal on small squads, and rotation patterns vary far more dramatically between clubs than they do in the Premier League. A side with a 22-player first-team squad will fundamentally not play the same way in midweek as on Saturday, and the market is consistently slow to price that gap on Tuesday-night kick-offs. I have built a substantial portion of my Championship returns over the years from being early to fade fatigue.
The £205 Million Game and Why It Distorts Everything
If you only remember one figure about the Championship, make it this one: the winner of the play-off final secures a minimum of £205 million in additional revenue across their first Premier League season, and up to roughly $490 million in total if they stay up. There is no single fixture in football that carries that financial weight. The Champions League final does not match it. No domestic cup final comes close.
That number does two things to the betting market. First, it warps club behaviour in February, March and April in ways that simple form-based models cannot capture. A side seven points off the play-off positions in late February will, more often than not, rotate aggressively in cup fixtures, recall loaned-out players, and pursue an entirely different tactical risk profile from the same side eight points back. The marginal upside from chasing sixth place is too vast to ignore.
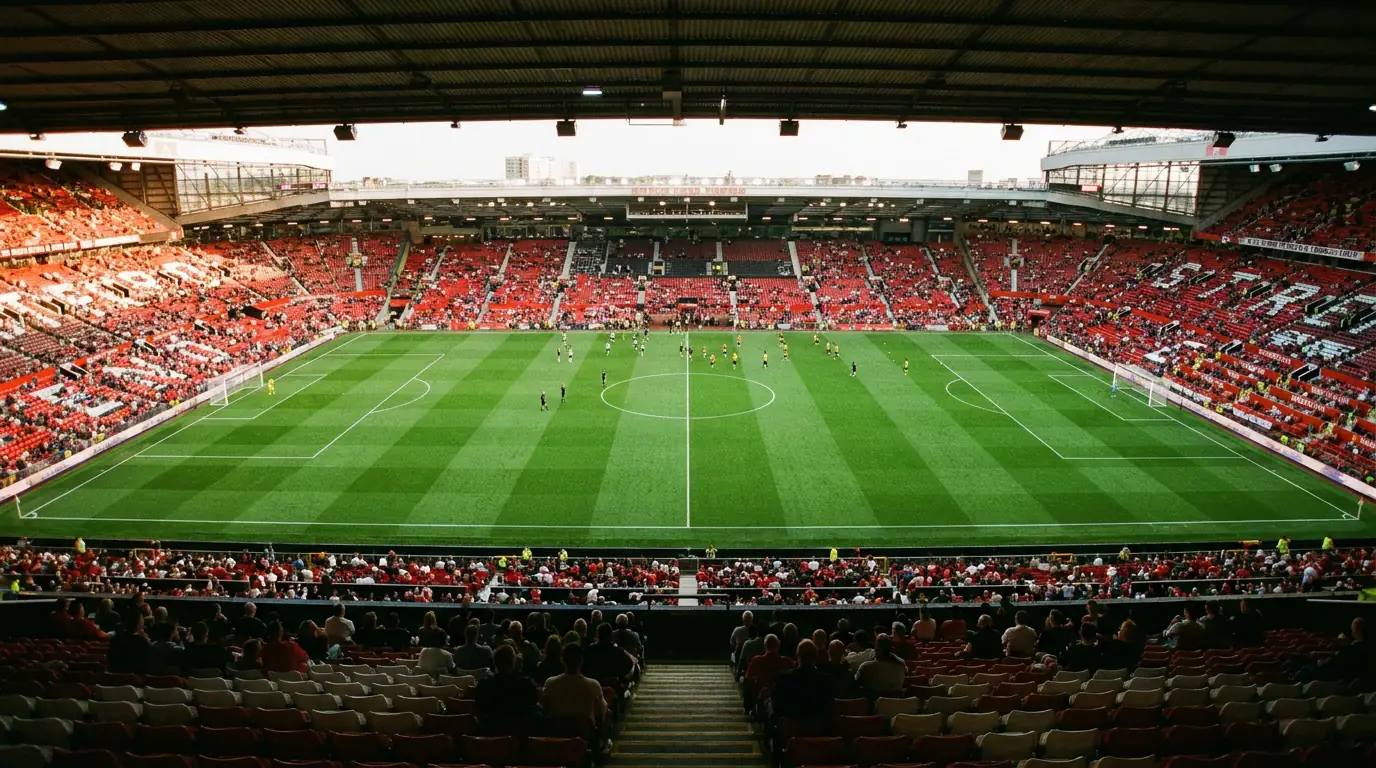
Second, it creates the most concentrated injection of owner capital in European football. Twelve Championship clubs in 2023/24 received equivalent owner injections totalling £554 million, with three clubs — Birmingham, Leeds and Middlesbrough — accounting for roughly 70% of that figure. That capital does not disappear into the building fund. It funds wages, transfers and the operational infrastructure required to compete for promotion. When I am pricing a fixture between a top-six Championship club and a mid-table side, the wage-bill differential between them is often larger than the equivalent gap in the bottom half of the Premier League.
The 2025/26 season delivered a textbook reminder of how seriously the parties involved treat the stakes. Middlesbrough’s official statement following a spying allegation against Southampton ahead of the play-offs read, in part: “We believe this sends out a clear message for the future of our game regarding sporting integrity and conduct.” That language — the formal weight of “sporting integrity” applied to a single regular-season episode — only makes sense once you understand the financial gravity sitting behind a play-off place. Nobody talks like that about a League One fixture.
The practical lesson for the bettor is to recalibrate motivation as a variable. In the Premier League, motivation is reasonably stable across the season because broadcast income smooths out the financial cliffs. In the Championship, motivation is a discrete function of league position at three key checkpoints — late November, late January and mid-March — and prices that fail to reflect motivation shifts at those checkpoints are where systematic edge tends to accumulate.
Reading Championship Form Without Being Fooled by It
Championship form misleads more than any other major English league’s form. The 2025/26 numbers underline the trap: 1,438 goals across the season, an average of 2.61 per match, and the longest winning streak — Southampton’s seven-match run — coming from a side that had been newly relegated and was reorganising mid-campaign. Žan Vipotnik finished the season as top scorer with 23 goals for Swansea City, a club that finished comfortably outside the play-off picture. None of those signals fit a tidy form-based narrative.
The reason form misleads here is the sheer turnover of players between transfer windows, and the consequent shifts in tactical identity. A Championship side that has won four out of five going into the January window can look completely different by the start of February if their leading goal-scorer has been sold to a Premier League club for £20 million. Conventional form tables do not capture that discontinuity. I treat the January window as a hard reset for any Championship model I am running, and I rebuild the rolling expected-goals profile from scratch using only post-window matches once I have eight or so fixtures of new evidence.

What does work consistently in the second tier is a more granular reading of process indicators. Shots conceded inside the penalty area, possession in the final third weighted by opposition quality, and set-piece dependency are the three signals I lean on most. Public xG data is patchier than in the Premier League — Understat and FBref both publish Championship figures, but the underlying tracking infrastructure is thinner, so the contextual depth of the modelling is lower. I treat those numbers as directional rather than precise, which is a different posture to how I read the same data in the EPL.
Streak data is something else worth pricing carefully. The longest winning run of the 2025/26 season topped out at seven, which sounds substantial but actually understates how rare sustained dominance is in this league. Even table-topping sides routinely drop points in unlikely fixtures, because squad depth limitations mean a single suspension or injury reshapes the eleven materially. A 13-game unbeaten run in the Championship is not a hot streak — it is a structural advantage that the market will eventually price correctly. By the time it does, the next three matches usually contain an awkward midweek away trip that ends the run.
Promotion and Play-Off Markets in Practice
The promotion market opens in May for the following season and shuts in May the year after. That is a long position to hold capital in, and I treat it accordingly. The first principle: parachute payment sides are systematically favoured in early pricing because operators model their wage bills accurately. The second principle: that favouritism is occasionally overdone, particularly when the recently-relegated side is in evident turmoil — managerial uncertainty, player exodus, ownership friction.
The play-off route is where pricing gets most interesting. Only three teams that entered the play-offs from third place have been promoted in the last ten years — a strike rate of roughly 30%. That number sits awkwardly close to the implied probability you typically see for a “to be promoted” market on a third-placed side in late April, but the implication is that third place is more often a trap than a launchpad. Sides finishing third have, by definition, played 46 matches at a level just short of automatic promotion, and they then face two ferocious play-off ties against opposition that has had time to reorganise.
My standing approach is to wait for the play-off pricing to firm up after the semi-final first legs. The two-legged structure is genuinely informative — the away leg in particular tends to reveal more about a side’s tactical maturity than any single regular-season fixture — and the prices on aggregate winners post-first-leg tend to remain slightly slow to incorporate the qualitative read on those matches. If you are looking for a focused entry point into the play-off picture, the period between the first-leg whistle and the second-leg kick-off has historically been my favourite window.

The play-off final itself is its own discipline. The price asymmetry between favourite and underdog typically tightens dramatically at Wembley, and the goalscorer markets in particular become a structurally interesting place to look. I have written about the specific dynamics of how the play-off final at Wembley breaks normal pricing patterns at greater length than I can do justice to here.
Relegation and the Survival Market
The relegation market in the Championship rewards patience and punishes early conviction. The three sides that go down are almost never the three sides priced shortest in August. Owner injection, mid-season managerial change and the January window all conspire to scramble the bottom-six picture in ways that the pre-season market cannot anticipate.
What I focus on instead is the “to be relegated” market in late October. By that point, eleven or twelve fixtures have been played, ownership intentions have signalled clearly, and the difference between a side that is genuinely badly run and a side that has merely had a poor start has begun to clarify. Backing relegation candidates at that checkpoint is a much sharper exercise than guessing in August.
The reverse market — sides priced as relegation candidates who will survive — is where I have found more reliable value. The behavioural bias against newly-promoted clubs is strong, and operators occasionally price every promoted side at near-identical relegation probabilities. That is a modelling shortcut, not a defensible position. A promoted side with strong recent xG numbers, settled management and a coherent recruitment strategy is materially less likely to go straight back down than one without those traits, and the gap between the price and the genuine probability can persist into November.

Finishing position markets sit alongside the binary relegation question and offer more granular exposure. A “to finish bottom” price, or a “bottom three” price specifying a particular club, often diverges from the implied probability hidden in the broader relegation market in ways that suggest the same modelling shortcut at work. Cross-checking the two markets against each other is one of the simpler arbitrage-style edges available in Championship outright betting.
Goal Markets in a League That Scores
The 2025/26 season’s 2.61 goals per match is not an aberration. The Championship has consistently outscored the Premier League in goals per match across recent seasons, and the structural reasons are worth understanding before you start backing overs as a default.
Defensive coaching in the Championship is, on average, less sophisticated than in the top flight. Squads are smaller, training time is constrained by fixture congestion, and individual defensive errors are more common because the marginal defender in a Championship squad is operating closer to the level limit of his ability. The combination produces matches with more chaotic transitions, more high-leverage individual mistakes, and more goals scored from positions that elite Premier League defences would routinely close down.
That structural feature suggests overs as a default position, and the market is broadly aware of it — over 2.5 lines in the Championship are priced shorter than the same lines on equivalent Premier League fixtures. Where I find recurring value is in over 3.5 and over 4.5 lines on fixtures between attacking sides with porous defensive numbers. The market prices the lower line correctly but consistently underprices the chance of a genuine goal-fest when both sides have xG-against figures above 1.5 per match.
BTTS Yes is similarly more often correct in the Championship than in the EPL, but the price difference between the two leagues at standard lines reflects that. The under-discussed angle is BTTS No on fixtures where one side has visibly tightened defensively in the recent past — typically following a managerial change. Markets adjust slowly to defensive improvements, particularly when those improvements arrive at clubs without significant media profile, and that lag is where I have found BTTS No to pay.
How Championship Betting Actually Differs from EPL Betting
The instinctive answer — “the Championship is just less predictable” — is partially true and mostly unhelpful. The more useful framing is that the Championship has different signal-to-noise characteristics across each market type, and the bettor needs to adjust which markets they prioritise rather than just accepting higher variance everywhere.
Match result markets are noisier in the Championship and require larger sample sizes before xG-based models stabilise. I treat 1X2 plays here as lower confidence and stake them more conservatively than equivalent EPL positions, even when the modelled edge looks similar on paper. The variance penalty is real.
Goal-line markets, by contrast, are cleaner in the Championship than in the EPL because the underlying goal distribution is wider and more reliable. The same xG-derived expected goal total translates more directly into observed outcomes here than it does in the more variance-heavy Premier League, where individual elite finishers can drag actual goals away from expected goals more violently.
Player props in the Championship are sparse, less liquid and more frequently limited to small stakes. They can still be value, but the operational friction is high enough that I rarely pursue them unless I have a particularly strong read on a specific player’s role change. The Premier League is the cleaner environment for prop-driven work.
Outright markets — promotion, play-off entry, relegation — are where the Championship genuinely outperforms the EPL as a sustainable edge source. The longer time horizon, the deeper informational asymmetries between bettors who watch closely and those who watch casually, and the financial weight of the underlying outcomes combine to make outrights a more productive use of analytical effort than the equivalent EPL outright markets, which are dominated by a small number of mega-clubs with well-modelled probabilities.
Finding Edge in the Mid-Table
The most overlooked space in Championship betting is the no-stakes mid-table fixture in February or March between two sides with nothing left to play for. These matches are dismissed by the casual market and lightly priced by operators because the analytical effort does not feel worth it. They are also where lazy assumptions about motivation produce mispriced markets with surprising regularity.
A mid-table Championship side in March is not unmotivated. It is a club whose owner is watching contract negotiations, whose manager is auditioning for next season’s job security, and whose players are individually playing for transfers, new deals or to remind selectors of their existence. The collective motivation is sometimes lower than at the top or bottom of the table, but the individual motivation is often higher because the personal stakes are nakedly on display.
I have backed unfashionable mid-table sides at home in March more times than I can count, usually at prices around 2.10 to 2.40 against larger-name opponents whose own motivation has visibly slumped. The pattern is not universal, and I would not suggest it as a default. But it is a market segment that rewards close attention precisely because the lazy narrative says it does not.
The broader lesson is one I keep returning to: the Championship rewards bettors who treat it as a complex, well-funded, financially serious competition rather than a Premier League waiting room. The clubs do not view it that way, and the market should not be approached that way either.
