
Over/Under 2.5 Goals: Reading the Most Liquid Goal Line in Football
 Available in US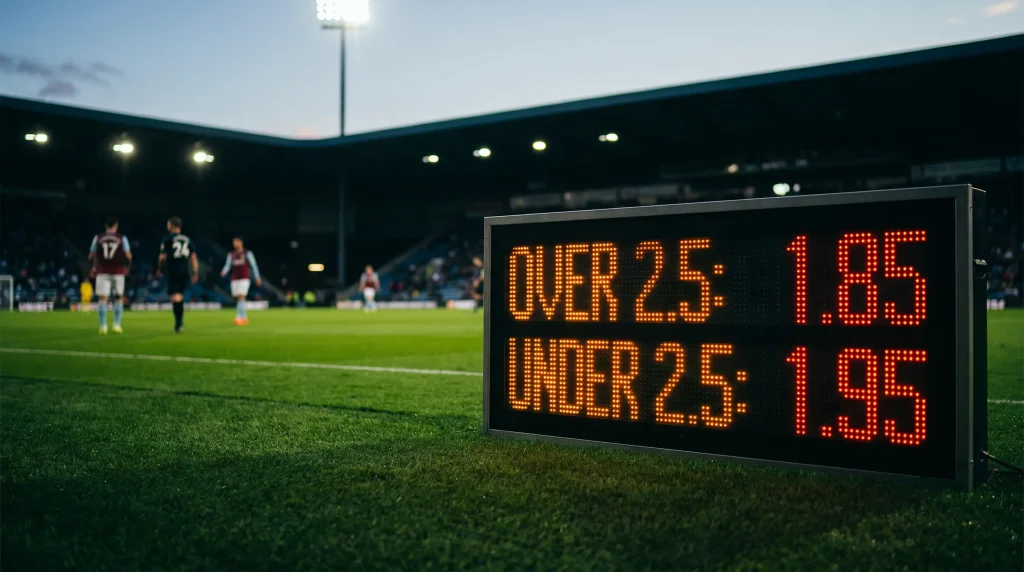
The 2.5 goal line is the most heavily traded football betting line in the UK market and it’s also the most heavily mis-played. I spent my first proper season as an analyst pretty much losing money on totals before I realised what I was doing wrong — I was reading league averages and team averages, not joint distributions. The Championship hit 2.61 goals per match in the 2025/26 season across 552 fixtures. That single number tells you something. What it doesn’t tell you is which Championship fixtures cross the line and which fall short, and that’s where the actual betting decision lives.
Every operator runs deep liquidity on 2.5. The pricing is sharper than anywhere else on the goal-totals ladder. The margin is thinner. The implication is that finding edge here is harder than people think — but the edge that does exist is more reliably extractable because the underlying market is so well-priced that small disagreements with the line are unlikely to be the bookmaker’s mistake.
Why 2.5 Is the Anchor Line for Football Totals
Football scoring distributions cluster heavily around two and three goals per match in the major European leagues. Two-goal matches are the modal outcome in EPL, three-goal matches dominate in higher-scoring leagues like Championship and the Bundesliga. The 2.5 line — settling over on three or more goals, under on two or fewer — sits right at the centre of those distributions, which is why it attracts the deepest liquidity.

Operators price 2.5 first and price every other goal line off it. Alternative totals like 1.5, 3.5, and Asian goal lines like 2.25 or 2.75 are derived from the underlying scoring distribution, with margin reapplied at each derivation. The 2.5 price is the cleanest read on what the bookmaker thinks the joint scoring distribution of both teams looks like.
This makes 2.5 a reference point even when you’re not betting it directly. If the 2.5 price implies, say, fifty-five percent for over, you can use that single number to infer what the bookmaker thinks the Poisson parameters of both teams should be — and that inference becomes the comparison point for every other line on the same fixture. Over 1.5 should be much shorter, over 3.5 should be much longer, and the gradient between them tells you whether the bookmaker is pricing a tight low-scoring contest or an open potentially-high-scoring one.
xG Totals Versus the Market Line
The single most powerful edge on the 2.5 market comes from comparing the bookmaker’s implied scoring expectation against your own xG-derived expectation. The mechanic is straightforward — if your model produces an expected total of 2.9 goals for a fixture and the market line is pricing roughly 2.4 expected goals, the over side is value, almost regardless of which xG provider you use.

The research backs this up at a general level. A simple xG-based model applied to the Bundesliga, where the structure of league fixtures lets the model find consistent edges, can produce a return on investment around ten percent at average market prices and up to fifteen percent at best-available prices. Sascha Wilkens, who authored the relevant academic work, put it directly: “While xG-based forecasts are slightly less well calibrated than market odds, they capture certain signals that translate into consistent, albeit modest, profitability.” The signals he’s referring to live disproportionately in totals markets like 2.5.
The application to EPL and Championship is more nuanced because the markets are sharper than the Bundesliga and the public data sources are slower than the bookmaker’s proprietary ones. The principle still holds — xG-derived totals beat naive trend-based totals — but the edge is smaller and demands more careful sample selection.
The practical implementation: take rolling xG-for and xG-against for both teams over twelve matches on the same competition and same home-away split, blend them into an expected match-total xG, and compare that number against the market’s implied total. If your number disagrees with the market by more than fifteen percent in either direction, that’s a position worth taking. If it agrees within fifteen percent, you’ve confirmed the market is sharp and you should pass.
Reading Defensive Style and Its Effect on Totals
The teams that systematically depress totals aren’t the ones with the best defences in conventional terms — they’re the ones that play in a way that suppresses the joint goal count of the fixture. Low pressing intensity, deep defensive blocks, conservative possession in the final third — these stylistic traits compress both their own xG-for and their opponent’s xG-for at the same time.

If you’ve watched Championship matches involving a side managed by a defensively conservative coach, you’ll have seen this in action. The team doesn’t necessarily win clean sheets, but the matches they play are systematically lower-scoring than the participants’ individual scoring rates would predict. The market eventually catches up, but on the first half of a manager’s tenure the totals lines often haven’t fully adjusted.
The reverse case is teams that play aggressive high-pressing football and concede in transition. These sides distort totals upward — their own attacking output is high, the opponent’s response output is also high because they break against a stretched defensive structure. Both halves of the over 2.5 case land together for the same underlying reason.
The metric that captures this most cleanly is PPDA, but the simpler proxy is shot volume per match. Teams that average over fifteen shots and concede over twelve are structural over candidates. Teams that average under nine and concede under nine are structural under candidates. The fixtures that combine two of either type are where the strongest totals plays appear, before the market has had time to fully reprice.
Weather, Pitch and the External Factors Most Punters Ignore
Football is played outdoors in Britain from August to May. The weather is a feature of the product, and it affects scoring in ways that the public market is slow and inconsistent at pricing.

Heavy rain reduces shot conversion meaningfully. The ball moves unpredictably off wet turf, goalkeepers struggle to handle, and shooting from distance — normally a low-conversion category but a high-volume one — becomes even lower-conversion. Net effect: totals trend below expectation. Strong wind has a similar effect, particularly on aerial play and on free-kick deliveries from set positions. Cold weather is more ambiguous — frozen pitches change ball behaviour but don’t reliably suppress goals.
The Championship and lower divisions are where weather plays loudest. Pitch quality is more variable than the EPL groundskeeping standard, and in winter months on Tuesday-night fixtures in the north of England, conditions can deteriorate to a point where the totals expectation shifts significantly. Operators do price for known forecasts on the morning of the match, but they price conservatively, and short-notice weather shifts (a sudden squall, an unexpected cold snap) often don’t fully filter through.
The practical play here is monitoring weather on Saturday-morning EFL fixtures during the November-to-February window and looking for under 2.5 plays where the forecast has shifted toward heavy precipitation since the line opened. The edge isn’t enormous, but it’s real and it’s a structural feature of the UK calendar that doesn’t go away.
Alternative Totals at 1.5 and 3.5
If 2.5 is the anchor, 1.5 and 3.5 are the alternatives worth looking at when 2.5 itself doesn’t move. Each tells you something different about the implied distribution and each has tactical use cases the anchor line doesn’t.

Over 1.5 is the play when you’re confident at least one goal is coming from each side but unsure about the third. On Championship matches between two openly attacking teams, over 1.5 prices around 1.30 to 1.40 — short, but with a hit rate that justifies inclusion on builders or as a base leg in a small multiple. Under 1.5 is the rare contrarian play on heavy-defensive Championship fixtures and on cold-weather lower-league games.
Over 3.5 is where the value lives on mismatch fixtures. A top-six EPL side hosting a relegation-threatened opponent will typically price over 3.5 around 1.80 to 2.10 — long enough that even at a modest over-strike rate it’s interesting. The pricing tends to be slightly conservative because the bookmaker’s risk on these is asymmetric — they fear the 5-1 and 6-1 routs more than they fear the 1-0 grinds. That conservatism leaves room for value.
Under 3.5 is the leg I see most often misused. Punters add it to bet-builders thinking they’re hedging against a goal-fest, but under 3.5 is heavily correlated with the home-win-and-clean-sheet legs they’re usually pairing it with, so the operator’s correlation model prices the joint ticket without giving them meaningful additional cover. It’s a leg that often looks safer than it actually is once the correlation is properly accounted for.
The 2.5 line is the centre of the goal-totals universe, but it’s not the only line where edge appears. For the lower-favourite scenarios where Asian handicaps offer tighter pricing on the same underlying structural reads, the analysis is in the piece on Asian handicap football betting.
