
Player Props on the Premier League: A Market Where Edge Still Lives
 Available in US
The player-props market is where I spend most of my Premier League analytical time these days. The match-result and totals markets are sharp — sharp enough that finding genuine edge requires luck or specialised information — but the per-player props are where the bookmaker’s pricing models still struggle, and where careful work translates into measurable yield. Around 290 million online bets a month go through UK operators, and a growing share of that volume now sits on player-specific markets that didn’t exist as serious products a decade ago.
The headline player markets — shots, shots on target, tackles, passes completed, fouls committed, cards received — are priced from per-player models that aggregate season-long data and project forward to the specific fixture. Where those models have blind spots, the opportunities appear. The bettors I know who consistently profit on EPL betting do so primarily through these markets, not through the headline match-result lines.
Shots and Shots on Target as the Core Market
The shots and shots-on-target markets are the cleanest entry points for player-prop analysis because the underlying data is rich and the per-player tendencies are stable across many fixtures. A forward who averages 3.2 shots per ninety minutes over a thirty-match sample has a genuine underlying tendency at that rate — the variation match-to-match is large, but the central tendency is reliable.

The bookmaker’s pricing model takes the player’s season shot average, adjusts for the opposition’s shots-conceded average, adjusts for expected minutes, and produces a per-match shots line. The line is typically set at the integer below the projection (so a player projected for 2.6 shots is offered at “2 or more” and “3 or more” lines, with the prices reflecting the projection).
The pricing weaknesses are predictable. Players whose role has recently shifted — moved from a wide position to a central one, or from a deeper midfield role to attacking ten — see their underlying shot rate change before the model fully updates. Players whose teams have just changed manager often see their shot rate shift in response to tactical changes. Players returning from extended injury layoffs sometimes return at lower shot rates than their pre-injury averages, sometimes at higher rates if their role has been adjusted.
The work to do on shots props is identifying the players whose recent six-match shot rate diverges meaningfully from their season-long rate, and figuring out whether the divergence reflects sustainable change or short-term variance. Sascha Wilkens noted in academic work on xG-based forecasting that “xG-based forecasts capture certain signals that translate into consistent, albeit modest, profitability.” That principle applies to shots props as well as to totals — the model has signal, the implementation has blind spots, and the edge exists in the gap between the two.
Tackles and Defensive Player Props
The defensive-player markets are where the player-props market is most consistently soft. The bookmaker pricing model on defensive midfielders’ tackle rates and centre-backs’ clearance rates is built from per-player averages, but the per-fixture variance is enormous and the pricing model treats the variance more conservatively than it should.
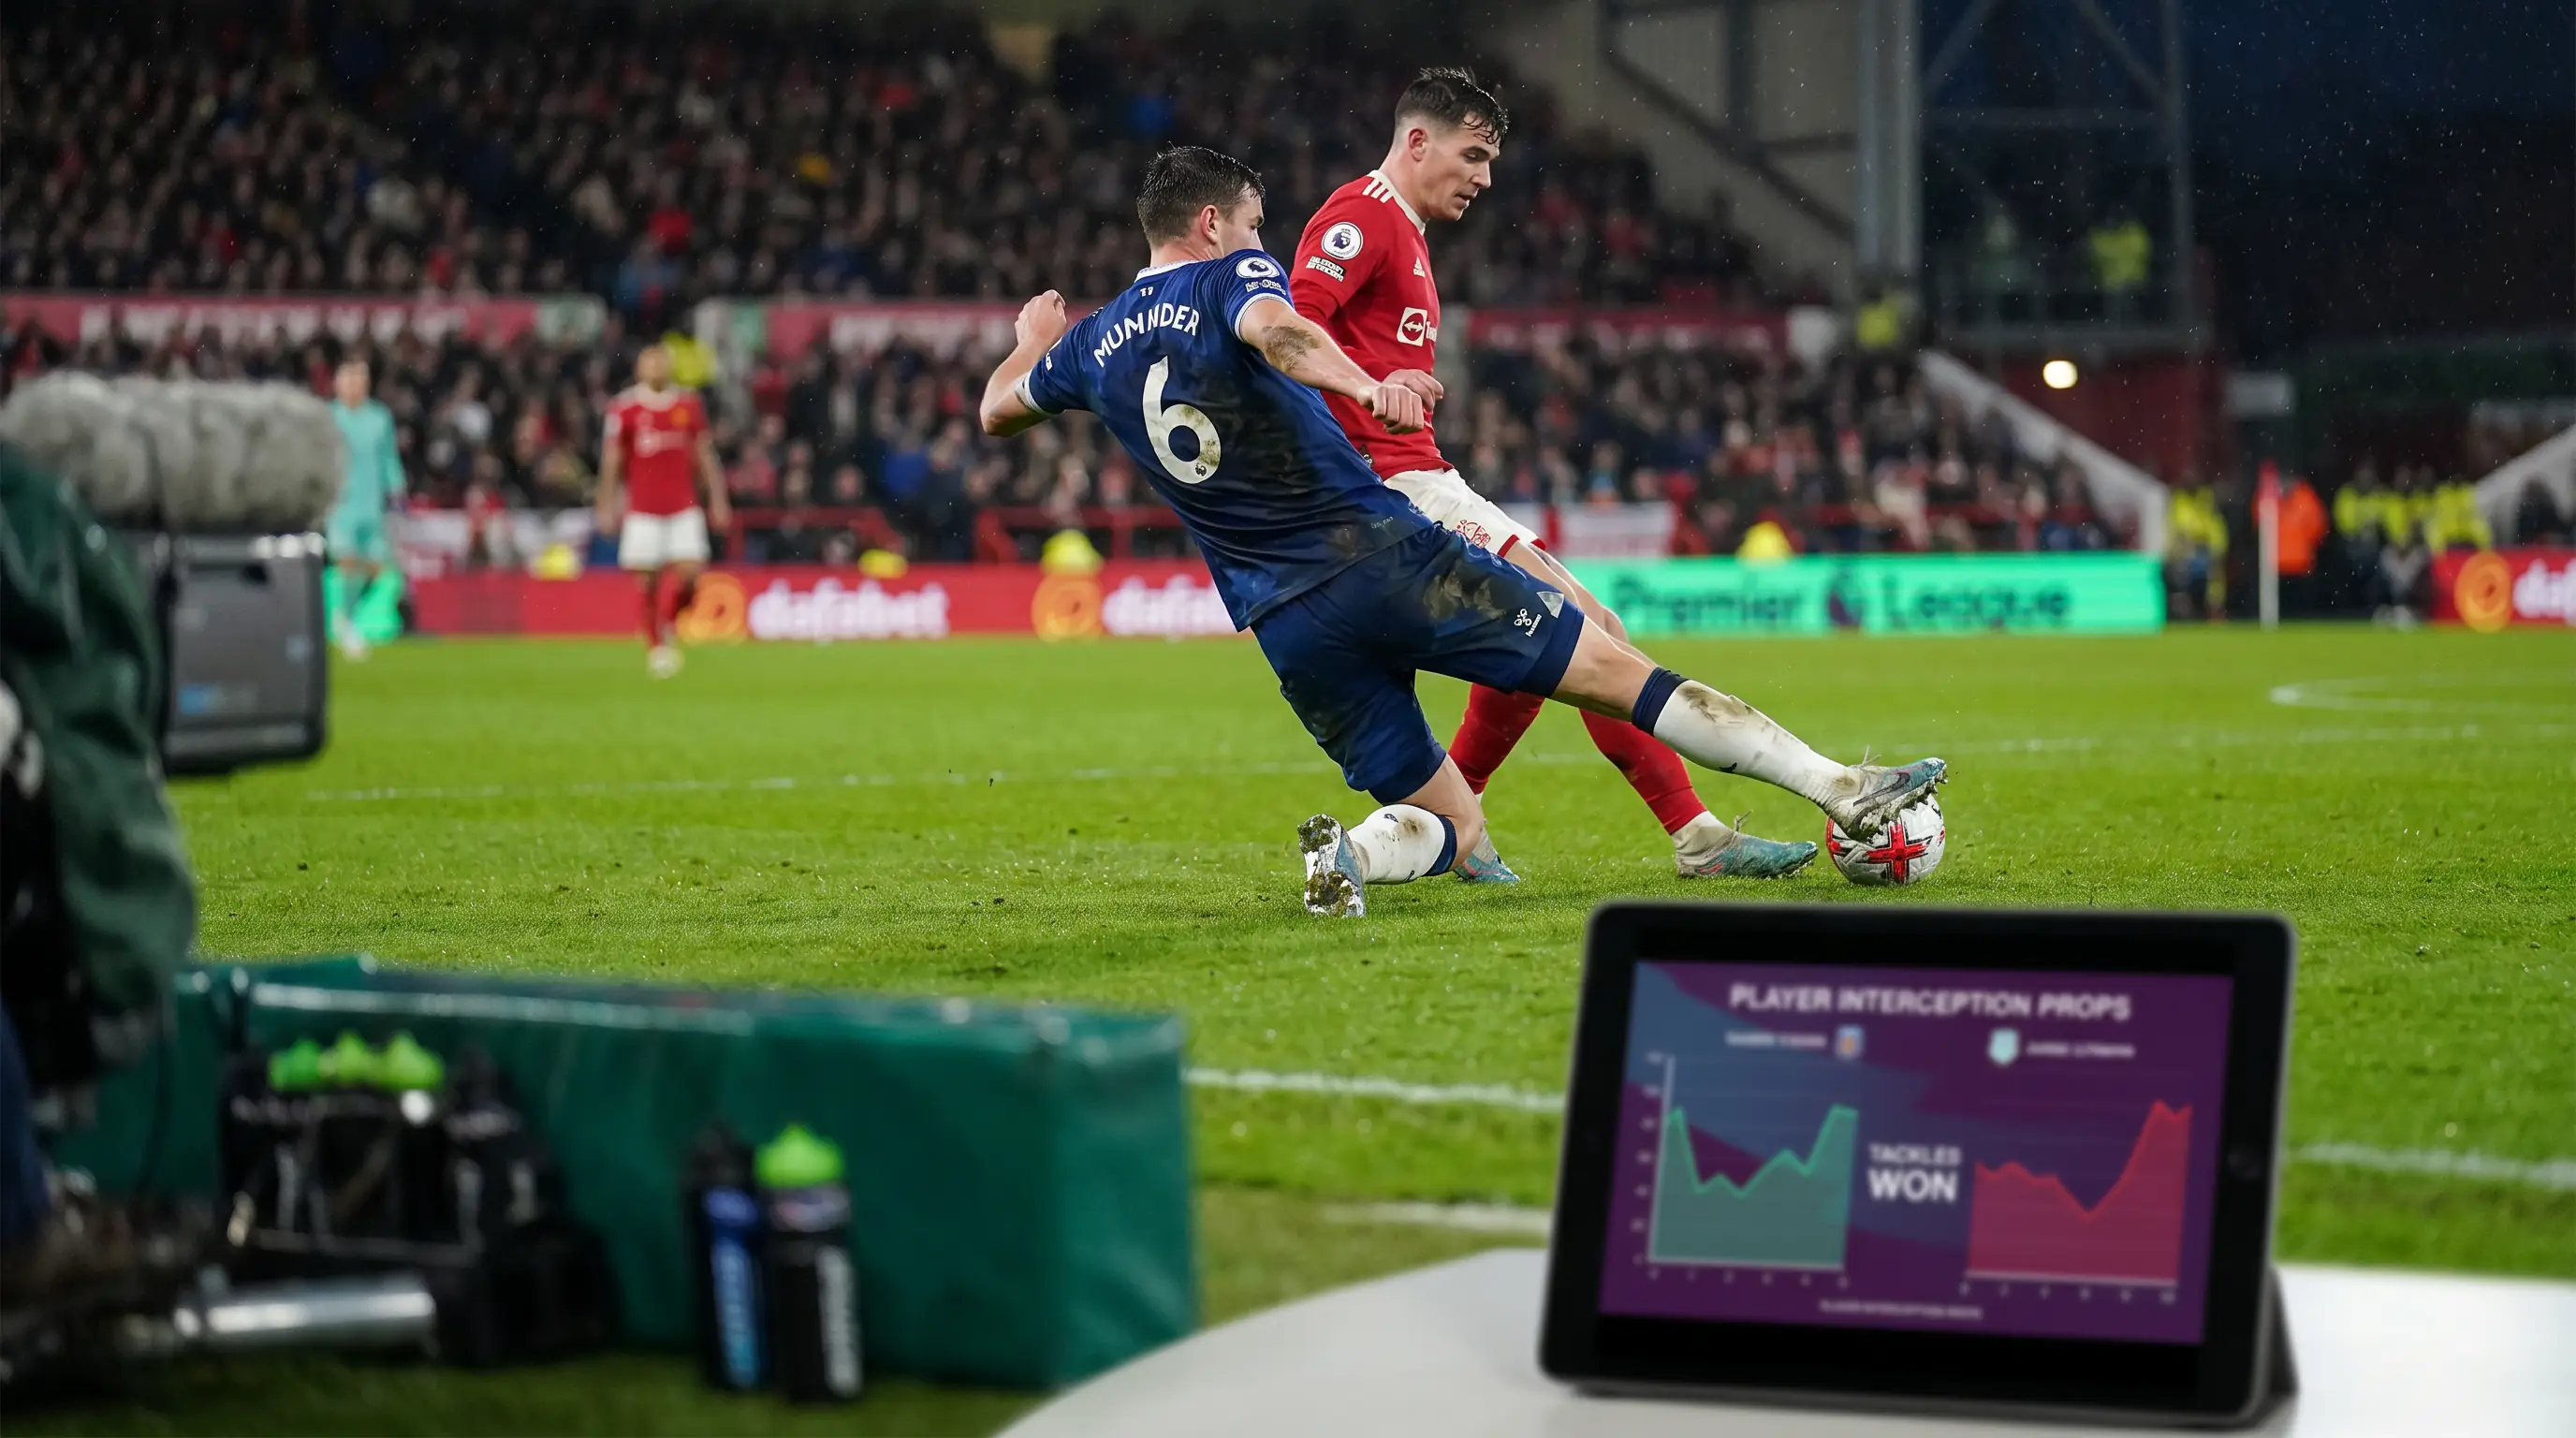
A defensive midfielder against a possession-heavy opponent will have more defensive opportunities than the same player against a counter-attacking team that gives them little of the ball to chase. The line on tackles should adjust significantly across these two scenarios, but operator pricing often shifts by only one increment when the underlying expectation shift is much larger.
The bet to look for is a defensive player facing an opponent whose style matches their defensive specialty. A pressing-style holding midfielder facing a team that builds patiently from the back has structurally more pressing-based defensive opportunities. A reactive defending centre-back facing a side that creates from set pieces has more clearance opportunities. The match-up-driven inputs are the edge, and they’re not always captured in the pricing.
The other defensive market with persistent value is fouls committed. Players with a high fouling rate — typically defensive midfielders with limited mobility, or aggressive ball-winning fullbacks — show up systematically across the fouls market. Their underlying foul rates are stable, the opposition match-ups can shift expectation meaningfully, and the bookmaker’s pricing on individual foul lines often hasn’t ingested the most recent shifts in style or tactical role.
Goalscorer Props Beyond First and Anytime
The traditional goalscorer markets — first and anytime — are competitive but not the most interesting goalscorer props on the EPL. The more interesting markets are the secondary ones: shots inside the box, headed shots, shots from inside the six-yard area, and assists.
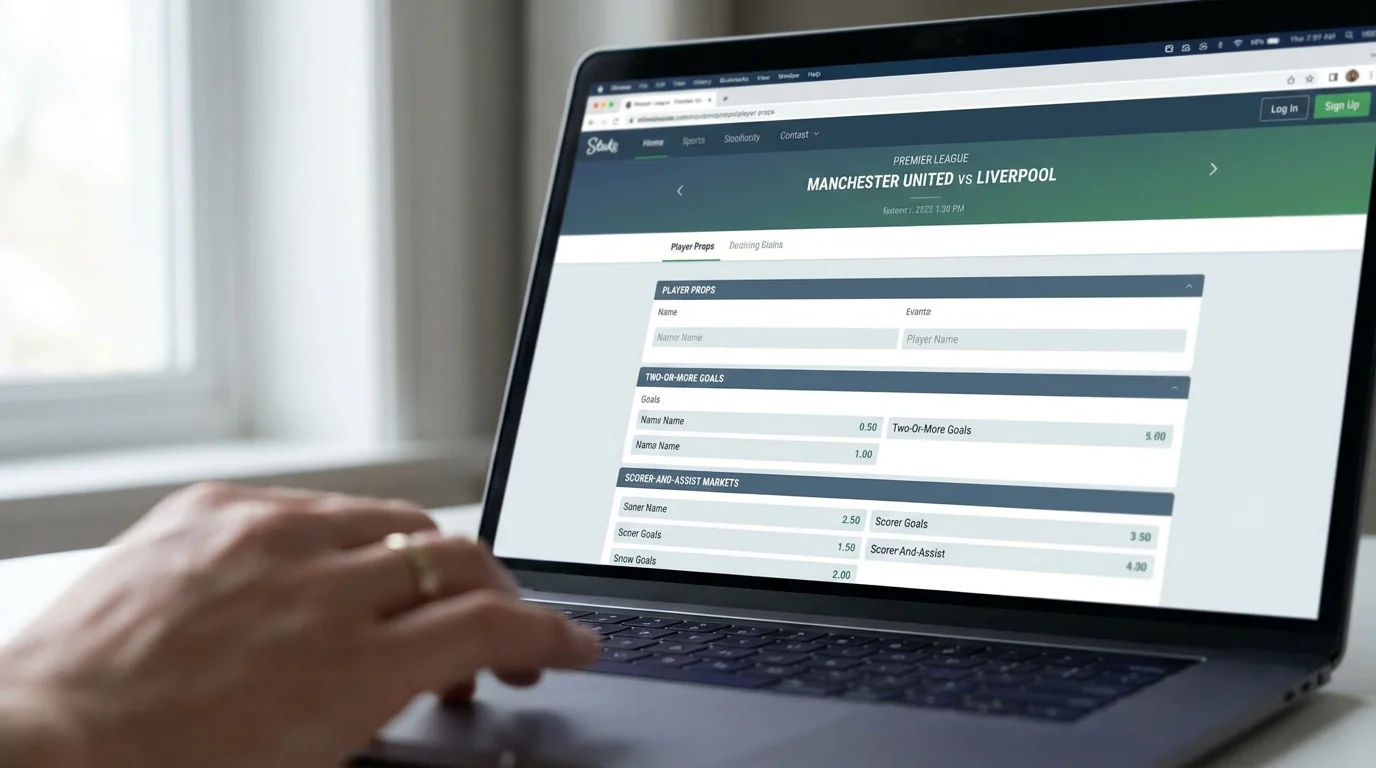
Shots-inside-box is particularly interesting for strikers who play a poacher role. A poacher’s value to their team isn’t shot volume — it’s the proportion of their shots that come from high-conversion locations. The market on overall shots underrates these players because their total shot count is low. The market on shots-inside-box prices them more accurately, but the line is sometimes still soft because the underlying data is thinner.
Headed shots is interesting for set-piece specialists and aerial-strong centre-backs who get into the opposition box on corners. These players have very predictable headed-shot opportunities — at least one or two per match in fixtures with high corner volume — and the prop pricing often doesn’t capture the fixture-specific corner expectation well.
Assists are the hardest player prop to predict but offer some of the longest prices when you do hit them. The market typically defaults to “no assist” as the favourite line, with “to assist” priced around 3.50 to 5.50 for primary creators. The conditional probability of an assist depends heavily on the player’s expected role (delivery taker on set pieces, primary creator from open play) and on the team’s overall goal expectation. Bettors who pair their goalscorer reads with assist reads on the same fixture sometimes find both legs land together, doubling the value of the underlying analysis.
Cards and the Referee Variable
The cards market on player props is heavily dependent on referee assignment, and the referee variable is one of the cleanest pricing edges in EPL betting. Some referees average 4.2 cards per match; others average 2.8. That’s a thirty-percent difference in baseline card expectation, and it shifts the entire per-player card pricing on the specific fixture they’re officiating.
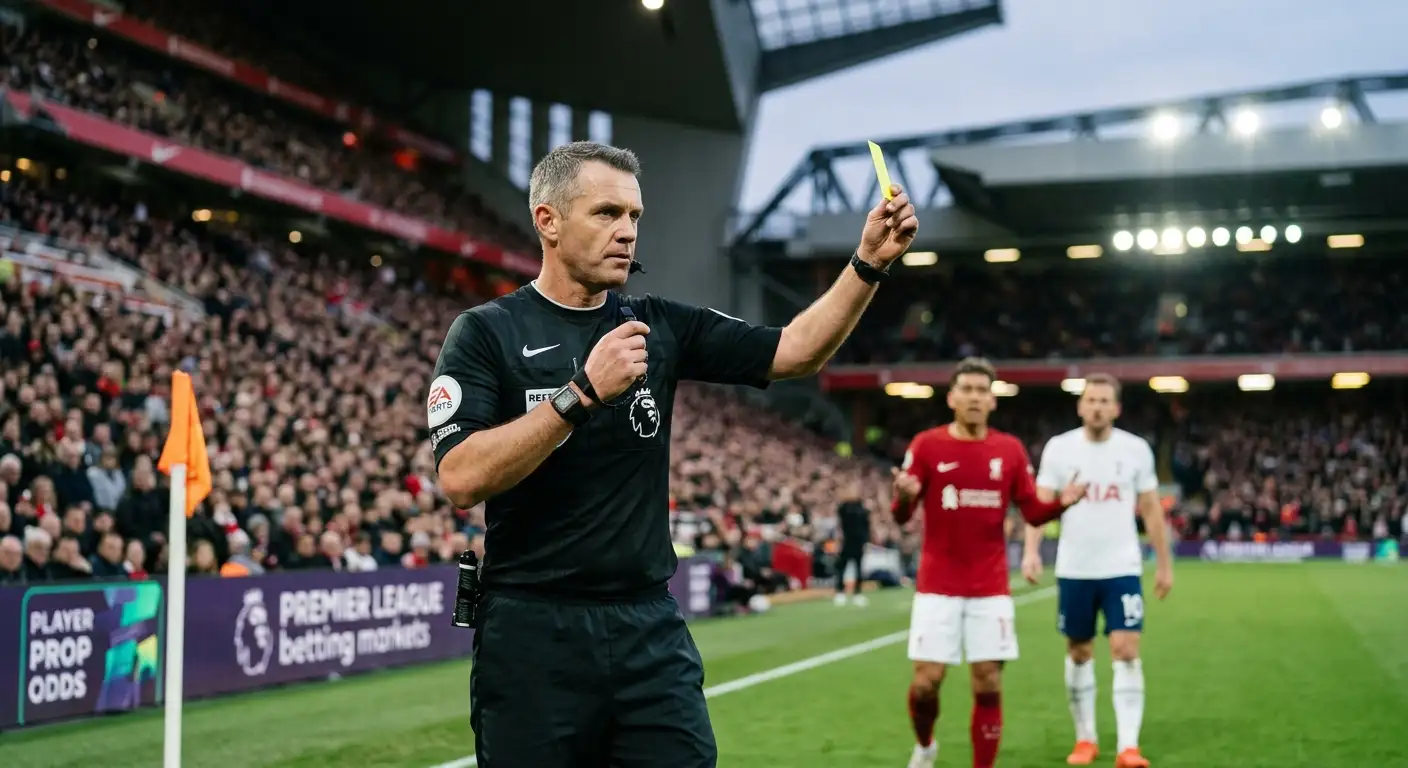
The market does adjust for referee — operator pricing engines have referee-specific multipliers built in. But the adjustment is often smaller than the underlying card-rate differential warrants. A strict referee assigned to a derby fixture might shift the per-player card line from 4.5 to 5 — when the actual card expectation under that specific referee in a high-tempo fixture might justify a shift to 5.5 or 6.
The bet to look for is a high-fouling player paired with a high-carding referee in a high-tempo fixture. The combination of all three factors compounds the underlying card expectation in ways the pricing model handles imperfectly. The over-cards line on individual players in these conditions is often the cleanest single bet on the fixture.
The opposite case — a low-fouling player paired with a lenient referee — produces under-card value on prop lines that have been set conservatively. The lines are sticky; they often don’t drop as far as they should when the underlying expectation supports a sharply lower number.
Sample Size and the Patience Problem
The hardest discipline in player-prop betting is sample-size patience. Individual player-prop bets settle as binary outcomes — the player did or didn’t hit the threshold — and a fifty-percent hit rate at 2.00 odds is structurally break-even before margin. To know whether your edge is real, you need a sample of at least a hundred bets settled, and probably closer to two hundred for a stable read.

That’s a lot of bets and a lot of time. The temptation to declare success or failure after twenty or thirty bets is enormous, and the variance over small samples is sufficient to look like edge when there isn’t any, or to look like flat performance when there’s a meaningful underlying advantage.
The discipline is to track everything, accept the variance, and let the sample build. Stake sizes should be conservative on player props specifically because the per-bet variance is high — a one-to-two percent of bankroll stake is more appropriate than a three-to-five percent stake.
The other patience requirement is on the analytical work itself. The blind spots in operator pricing models shift over time. A bet that produced consistent edge two years ago might be priced sharply today because the operator’s model has improved or because professional money has tightened the line. Continuous reassessment of where the soft spots are is non-negotiable.
For the broader question of how all these prop markets fit into the wider bookmaker pricing structure — and specifically how cash-out on player-prop bets interacts with the underlying margin compounding — see the analysis in the piece on cash out in football betting.
